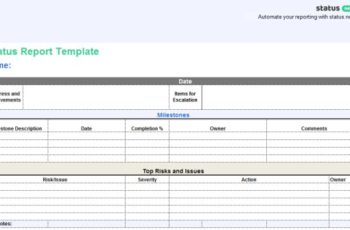
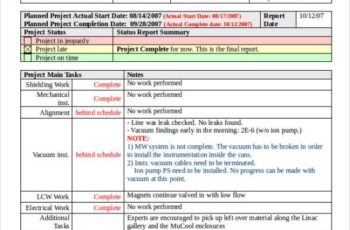
Status report template shows the required project information that is typically provided to participants. The right form of agile status reporting is the daily scrum.
Project Managers, Program Managers, Test Managers, and even the Scrum Masters always have a serious threat about something. Something that makes their nights sleepless. Are you wondering about what could be the reason behind this?
Pick the right answer from the options given: Reporting b) Reporting c) Reporting d) All the above
Confused with the options given? Yes, the right and the only answer is Reporting.
Wondering why do I emphasize more on this? As I am aware of the industry and people, one part agile methods don’t give importance is project status reporting.
I will explain the reason for this in detail…
Contents
Facts about Agile status reporting

Apart from a very few population in IT industry work in the real Agile companies, the remaining crowd falls into a trap where there is a combination of Agile and the traditional Waterfall methodology. Though you are working with a real Agile project, still you belong to the broader Waterfall setup. Typically, this situation hurts with the impact of traditional Waterfall method of reporting.
Whatsoever your situation is, it is required to fulfill the information demands of the key participants. Though the majority of the time, such participants are likely to be eliminated from the team or project, still need the critical data; vital data that influences them in their decision-making process.
Reports must be tapped to effectively manage the team.
Agile methodology has ample of choices for creating valuable and expressive reporting metrics. We will walk you through a small number of basic records that should be monitored in every Agile project. However, before we start let us understand in detail about the following.
Need for Agile Status Report
The answer is very clear at the moment. I will throw more light on this and explain the way IT industry works to substantiate the need for the status report.
Once a year or bi-annual forecasting phase is followed in many of the organizations to accomplish goals. In IT industry, this indicates the approving and finalizing of a pending work at the year start. As the days progress they work with the many amounts of different records starting at the coding phase and move up to program department and eventually the IT venture level for all product lines and business.
Thus, reports are essential.
It’s ideal for people with a close interest in the project who can dedicate the time to get to the scrum.
But it does not add value to other participants who get to the scrum each day, either they are concerned in less detail, or they have an interest in multiple projects and can’t be present at all the scrums.
We cannot negate report for people like this, but we need to have a traditional project status report. But in my experience, traditional status reports are often too lengthy, like fishing in a sea with a lot of unwanted information leading to finding the essence of the report with a microscopic eye. Status reporting is very critical for communicating decisions, changed, project progress, and issues to customers and team members.
Status reports offers visibility

- While making a significant proposal, reports are used to showcase the progression of the project.
- While facing issues, challenges, risks, reports are used to represent the same to senior official’s notice Even if everything is going good still reports provide support to the team to get the deserving recognitions and rewards.
- Reports are required to manage the team and project better. It helps to periodically monitor the development aligned with the targets. Senior Management, auditors, supervisors, everyone rely on the reports to have a clarity about the development aligned with the targets.
- These reports are used as a navigator to the new team members and new projects.
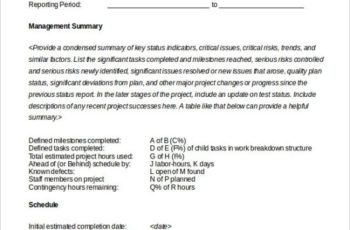
Overview of Agile Status Reporting: A detailed yet a crisp status report should have the following details
– Generic project information like submission date, name etc.
– High-level modification approval (resources, scope, schedule, items that need organization consideration)
– Metrics of the projects (Tasks to be started, completed tasks, in-progress tasks, time remaining, etc.)
– Status summary color-coded in red/amber/green (quality, overall status, budget, schedule, scope)
– Eminent performance review (performance Vs identified standards)
– Milestones accomplished and not completed
– Review of budget (actual, estimates, totals)
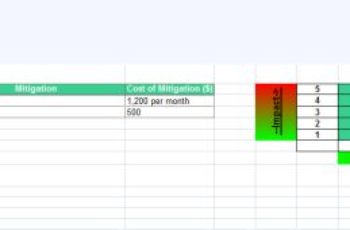
– Recognized risks and mitigation plans
– Supplementary remarks (based on the need)
*Fine-tune these fields by adding or excluding relevant fields to make sure this meets demands of the participants for status reporting.
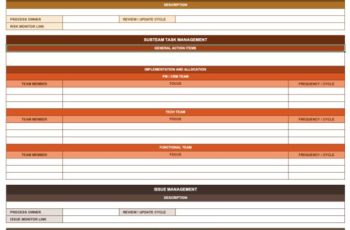
Various ways to maintain an agile status report template
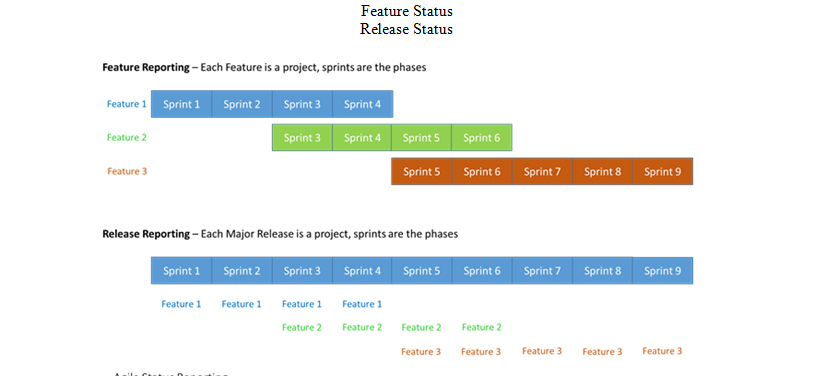
Sprint Status
Feature Status
Release Status
Sprint Burndown
- Burndown at a sprint level represents the easiest way to monitor and update stature (the legendary Red/Amber/Green), i.e., To estimate the project status during the sprint, and the probabilities of achieving the targets set during the sprint. The burndown chart offers the actual status update on Sprint development when used in the right way.
- The basis for the Sprint Burndown Chart: Sprint planning is carried out by the team members in Scrum at the start of a Sprint, accepting to implement the enhancement work with a defined amount of user story points.
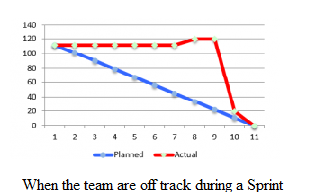
- Y axis represents the whole user story points accepted, X axis represents the dates of the entity during the Sprint. If the team executes it correctly, then a correct number of the task will be taken into the Sprint, which makes everything to fall on the track. This is demonstrated in the burndown chart given below.

As we always know, that each sprint may not be identical, and hence, in reality, it is not possible to achieve a perfect Sprint Burndown.
A Scenario
- When the Scrum teams miscalculate their skill in delivering the initial enhancement sprint such as upon a fresh project, freshly formed team, the team is old but new to Scrum process, and then such teams will not be able to progress as per the plan. With the help of the burndown chart issues can be brought under control:
- The chart above shows that the team required one point delay in the sprint to fall on the track.
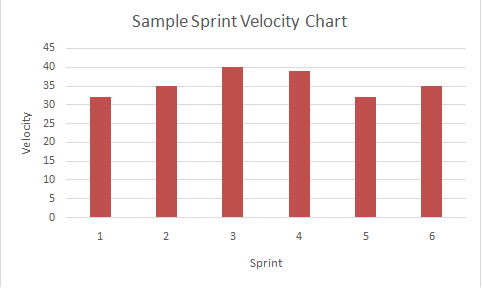
Sprint Velocity
- Sprint Velocity goes parallel in making the team accomplish the actual sprint breakdown.
Let’s describe that in detail
- Sprint Velocity denotes the fair amount of story points loaded to a team at a point during one Sprint which can be handled by them without any hassles. The decision is taken based on the past observations. Basically, it is the capacity of work a team can handle.
- Upon knowing the team’s velocity/capacity, managing their commitments and setting expectations accordingly is a cake walk.
- When Sprint Velocity is calculated properly it will help to avoid all kinds of miscommunication.
- The only way to overcome the limitation with Sprint Velocity is, at least 2 to 3 previous Sprint progress must be studied to set the expectations right.
As the chart shows the study of the team capacity for couple of occasions
Burndown Chart – Epic burndown, Product burndown and Release burndown
As Sprint burndowns facilitate to check the update at the Sprint-level, Burndown Chart – Epic burndown, Product burndown and Release burndown charts offer an analogous value.
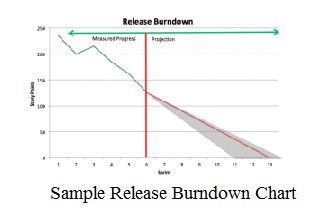
- Like a Sprint burndown, burndown chart at Release-level makes you know when you should expect to deliver a given span of work.
- As shown in the above figure, the example release burndown chart does not represent an ‘optimal’ trend line as given in the sprint burn down chart. During the 2nd or the 3rd Sprint, apparently fresh requirements have been added to the delivery backlog by the team, which leads to a rise indicated by the blue line close to the 3rd sprint, prior to resting on to a better steady burndown
In such a scenario Burnup Charts, must be used.
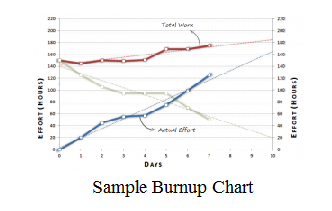
- Two key pieces of information are plotted in a burnup chart t– total work (story points, hours and so forth along with the accomplished attempt (progress vs total work).
- The red line indicates the span of work and it changes constantly.
The blue line indicates the continuous progression of the genuine effort.
- Below mentioned lessons can be learned from the burnup chart
- Up to 30% of the span of work has been modified for the sprint through the iteration. Though the initial plan of the team was to deliver for 140 hours’, they are currently delivering for 160 hours, which is 15% greater than their actual committed.
Regardless of the augmented productivity, there will be a shortfall in the span of the work modified due to the iteration performed during the sprint.
Upon understanding the above, following measures can be taken
- Managing the scope better
- Managing straightforward sprints (iteration)
- It is very easy to guess that the gray line in burn up chart and spike present in the burndown chart is highly not likely; this proves the influence of the burnup chart.
It is important to select burndown or burnup chart consciously
Earned Value
Earned Value method of reporting is primarily about computing the worth of money used up to the work completed
The few variables required to do the calculation are:
- Budget –expected rate fixed at the commencement of the project and revised if required.
- Real cost (RC) – the amount of the actual money used till now.
- Forecasted Value (FCV) – the amount of projected project delivered by this time.
- Earned Value (EV) – the exact value delivered till now in reality
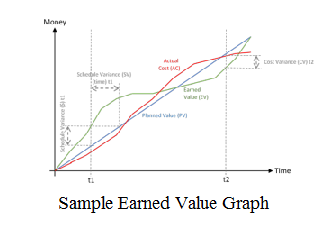
t1 – EV > RC.
t2 – EV < RC.
This implies the following likelihoods
- If you have delivered only half of the project span by spending more than the projected original budget, it clearly states that the team is inefficient or an incorrect initial budgeting has been done.
- If you have delivered more than required than the money in hand will be more than planned and this shows that the planning is done underestimating the efficiency of the team.
Change in the Span
- When the project is not settling anytime, then the team continuously thrives to align with the changes, new and dropped requirements.
- When the project span decreases at all these changes, then delivery can be done even before the forecasted time.
- If these changes increase the project scope, then your team need to work hard and the goal always seems to unachievable.
- Such changes are common in agile projects and hence reporting Scope Changes is very much important. This demands an additional ownership to be taken by the product owner and they must think before making any trivial modifications to protect the interest of the project.
Defects Trend
- Defects Trends helps in monitoring the defects outcome for a product or release.
- It is not possible to fix all errors within the Release or Sprint. It may even move to the upcoming release or sprint.
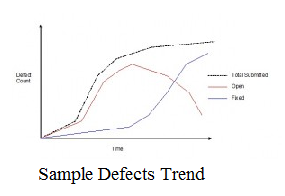
Advantages of marking and monitoring the Defects trend chart
- Code quality can be managed towards the release.
- The decision regarding the need for a Defects Spoke can be taken with the help of the defect trend chart.
- When the defects trend chart is visual it will stress the need for importance and responsibility amongst programmers, in turn, will revise the quality of the code much better.
Capacity/Load of the team
The Capacity/load of the team dashboard helps to provide an insight of the task assigned to your team.
Capture the following information for every single person involved in the project:
- Overall capacity in hours = time duration worked per day time assigned to work on the project.
- Allocated competence in hours = duration of time worked or story points time spent on each story point.
- Existing competence in hours = Overall capacity – Allocated capacity
Having captured this information, you can easily handle your entire project member’s distribution.
Conclusion
What is looked at an Agile Status Report from all the stakeholders? What is common about all the status reports? The answer is: to understand whether we are on track.
Keep in mind that, if your reports offer an evident and clear response to this query, then you have completed your job. Rest all is either supporting or exceptional information.
“The Agile status reports mentioned above could be customized once and created/modified based on the need within no time”.
There is no need in spending time for hours together in designing an Agile Status Report.
Wondering How?
Ask me, Yes, I have provided the different format of the Agile Status report in the reference section.